Strokes gained. Before you swing.

PinFlag predicts your strokes gained for any target, live, on the hole you are playing.

Launching on the App Store. Leave your email and we’ll tell you the day it’s live.
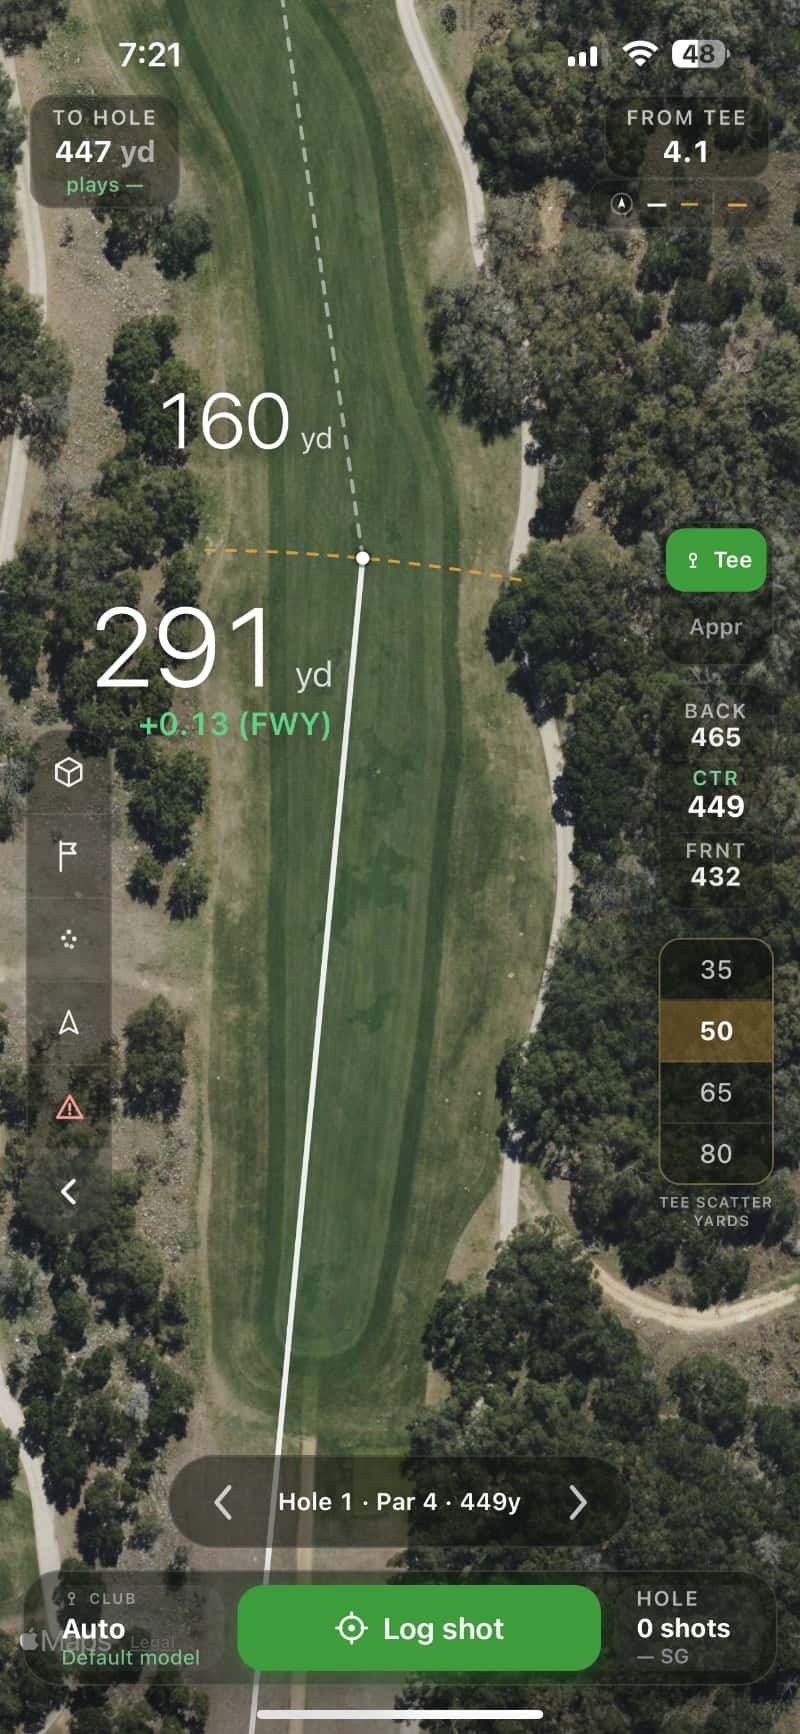
PinFlag on-course view: 291 yards to the aim point, plus 0.13 strokes gained from the fairway
Works in dead zonesTrackman, Garmin, Rapsodo importYour shots on the holeYour own dispersion in every number

Aim anywhere. Know the number.

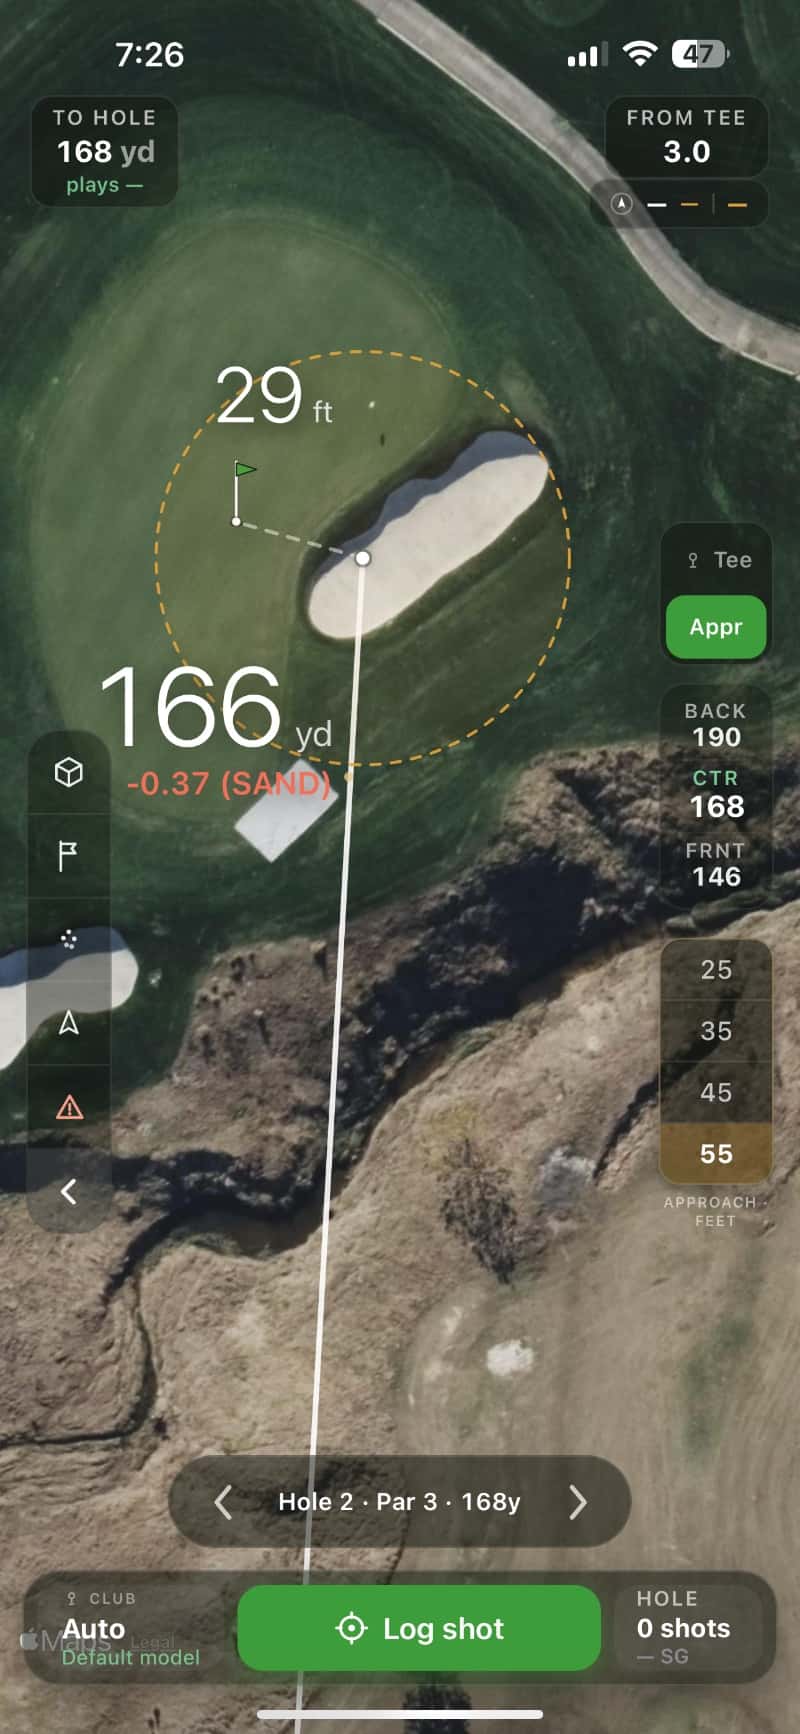
Approach with a dashed amber dispersion circle: estimated data, minus 0.37 from sand
PinFlag on-course view: 291 yards to the aim point, plus 0.13 strokes gained from the fairway
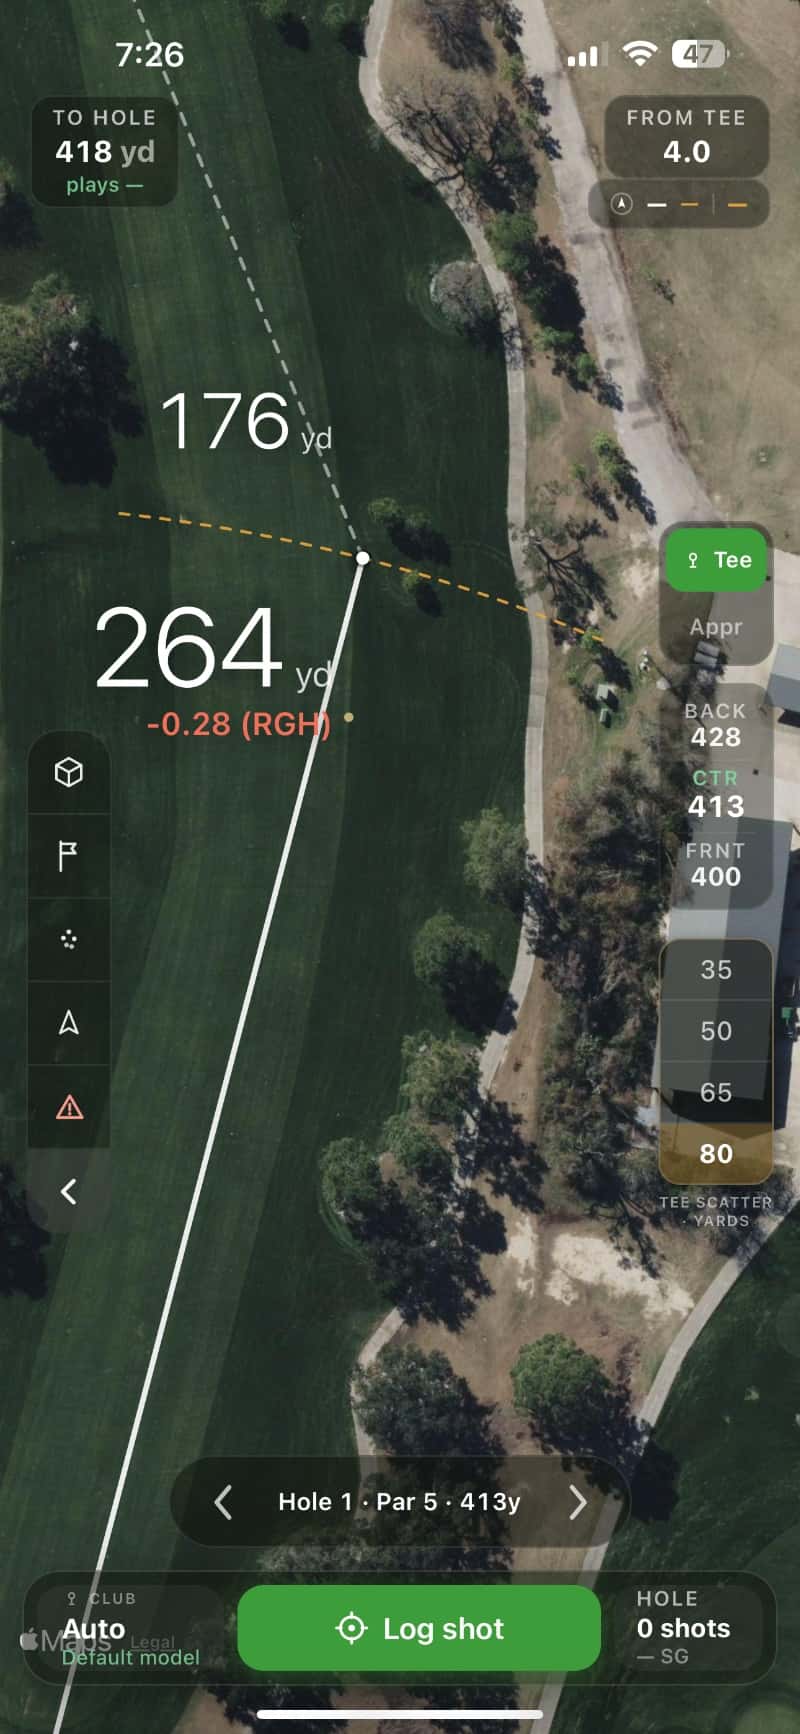
Aim point moved toward the rough: 264 yards, minus 0.28 strokes gained
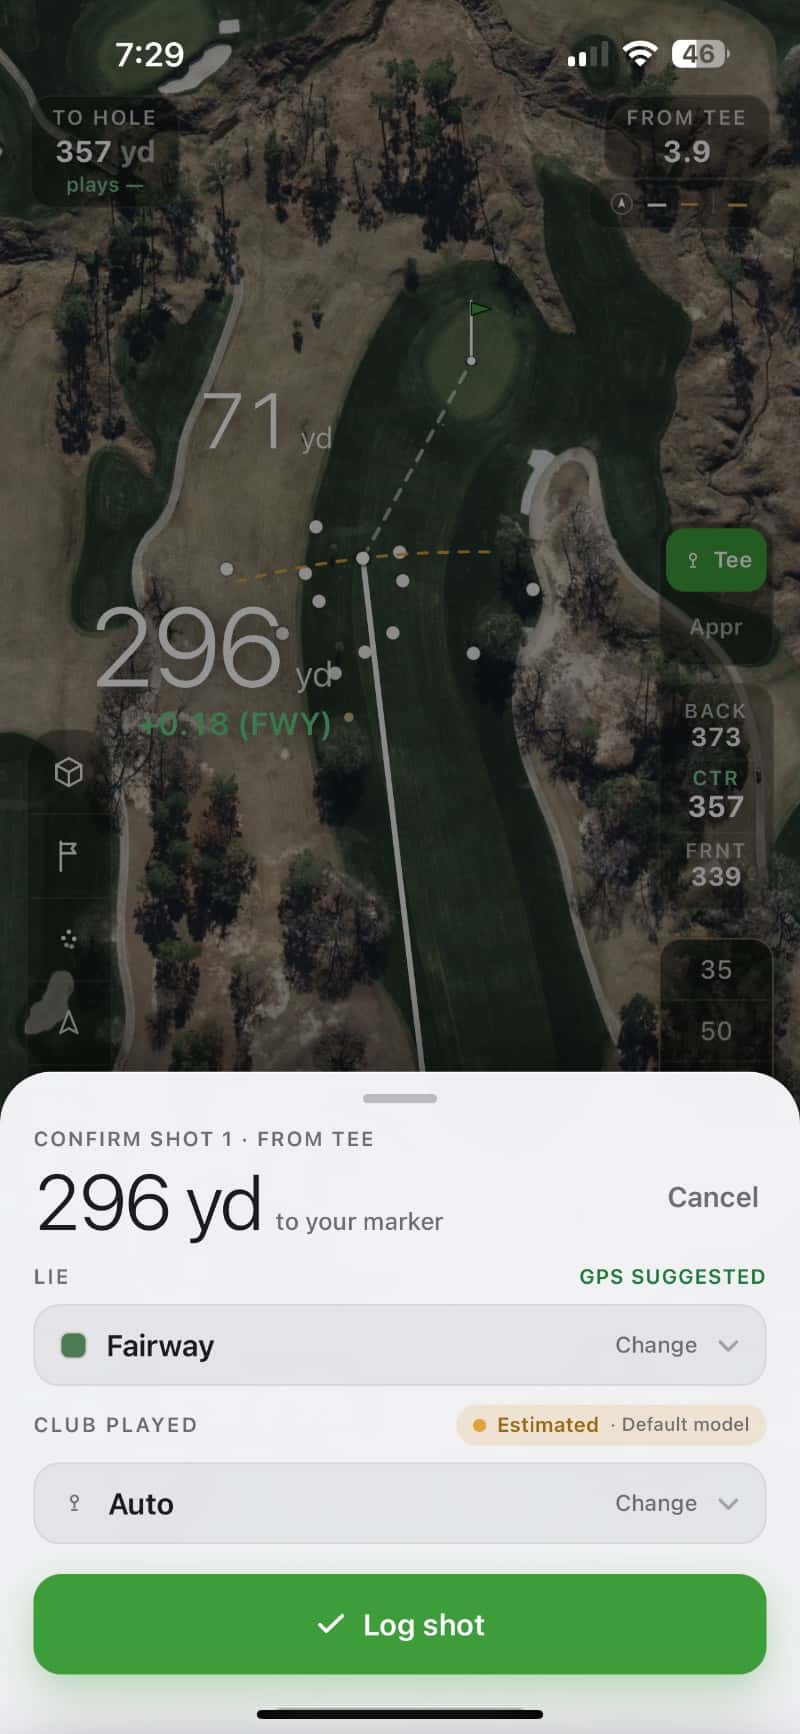
Logged shots plotted on the hole, confirm-shot sheet open at 296 yards

How PinFlag works

Every number is strokes gained on Mark Broadie’s published PGA TOUR baselines, the framework professional golf uses, for the shot in front of you.

On the tee and in the fairway, put the aim anywhere on the hole and PinFlag prices that target: the expected strokes from where you stand, minus the expected strokes from where your ball would finish, with your own dispersion around the aim and the lie read from the course map. Move the aim to the flag, the fat side or the layup and the number moves with it. A line over water is priced with the penalty stroke included.

Shot Cloud draws your launch monitor shots and your past shots on the hole, around the target you are considering, so the share of your dispersion that reaches the trouble is a picture of your own shots. Import Trackman, Garmin or Rapsodo sessions directly, or any monitor by CSV, and every number built on your carries is labeled Measured.

Logging is two taps: the target, then where the ball finished, with the club and lie confirmed in one sheet. Nothing to buy, charge or clip on. Everything is stored on the phone as you play, so a dead zone never interrupts a round, and any tap can be undone. Because each shot records where you aimed as well as where it finished, your dispersion is measured from real rounds too.

Insights breaks every round down shot by shot: strokes gained by driving, approach, short game and putting, proximity by distance band and by club, a start-position table of distance by lie, three-putt frequency and make rate, a heat map of your leaves, landing zones off the tee, each hole’s shot trail, and Score Killers, the card that totals the three-putts, two-chips, penalties and doubles that cost whole strokes. Benchmark lenses reprice the same shots against a Tour, Scratch or handicap level table.

Why golfers get PinFlag

What you get on the course, and what you get after the round.

  • The number arrives before you swing. Put the aim on any target on the hole you are playing and read its strokes gained, priced with your own dispersion and the lie the course map shows there; move the aim and the number moves.
  • Your real dispersion is drawn on the hole. Shot Cloud shows your launch monitor shots and your past shots around the target, so the carry over the water is a picture of your own game rather than a guess.
  • Two taps log a shot, with nothing to buy, wear or charge, and it works with no signal. The scorecard scores itself and any tap can be undone.
  • Every round becomes a shot-by-shot breakdown: strokes gained by category, proximity by distance band and club, Score Killers, heat maps, landing zones and benchmark lenses that read the round on your own scale.
  • Every number is strokes gained on Mark Broadie’s published PGA TOUR baselines, the framework professional golf uses, and carries a Measured or Estimated label so you always know what stands behind it.
  • Golfer is $14.99 a month or $99.99 a year with every feature included and a 14-day trial on the annual plan through the App Store; Coach is $80 a month for the coach plus ten students; Facility is $299 a month for a whole program.

Golfer $14.99/mo or $99.99/yrCoach $80/moFacility $299/mo

See pricing

Questions golfers ask

Short answers here; every question we are asked is answered in full on the answers page.

What is PinFlag?
PinFlag is the iPhone golf app that shows live predictive strokes gained on the hole you are playing: pick any target and see the number before you swing, with your own dispersion drawn on the hole. It imports launch monitor data, logs shots in two taps, and breaks every round down shot by shot on Mark Broadie’s published PGA TOUR baselines.
Which golf app shows strokes gained before you hit the shot?
PinFlag, on iPhone. On the hole you are playing you place an aim point anywhere, and the app shows the strokes gained of that target using the lie the course map shows there, the exact distance to the pin you placed, and your own dispersion pattern around the aim. Pick a different spot and the number changes. It is the number that answers "is this the right target" while you still have the choice, and PinFlag is built around it.
What is Shot Cloud in PinFlag?
Your launch monitor shots and your past on-course shots, drawn on the hole you are playing around the target you are considering. Instead of a dispersion number, you see the actual pattern you hit with that club laid over the fairway, the rough and the water in front of you, so the decision is made against your real spread on the real ground. Shot Cloud is priced live: the strokes gained for the target already reflects the pattern you are looking at.
How do you log a shot in PinFlag?
Two taps on the map. First you set the target you are playing to, then, after the shot, you place where the ball finished, and confirm the club and the lie in one sheet. The whole flow is built for one thumb: the map pans under a fixed mark and nothing commits until you confirm. Because each shot records both the target and the result, PinFlag learns your real on-course dispersion from every round as well as pricing the shot, and any tap can be undone.
Which launch monitors work with PinFlag?
Trackman, Garmin and Rapsodo files import directly. Every other monitor, SkyTrak and Foresight included, imports through a mapped CSV: you tell PinFlag which column is the club and which is the carry, set the units, and the session comes in, up to 5,000 shots at a time.
What stats does PinFlag show after a round?
Strokes gained by driving, approach, short game and putting, per round and across the season on a radar; a per-shot list sortable by start distance, lie or proximity; fairways, greens in regulation and putts derived from the shots; approach proximity by distance band and by club, with best, median, share inside 15 and 30 feet and dispersion circles; a start-position cross-tab of distance band by lie with greens hit and strokes gained per cell; short-game proximity by lie; up-and-downs and sand saves; three-putt frequency and make rate by distance; Score Killers, which counts the three-putts, two-chips, penalties and double bogeys that cost whole strokes; a heat map of leaves around the hole; landing zones off the tee; and each hole’s shot trail on the map.
Is PinFlag free?
The calculators on pinflag.io are free with no account. The app is a subscription: PinFlag Golfer is $14.99 a month or $99.99 a year with a 14-day trial on the annual plan through the App Store; Coach is $80 a month covering the coach and up to ten students; Facility is $299 a month by request. Every plan gets every feature: the number before the swing, Shot Cloud, launch monitor import and Insights; the difference is how many golfers it covers. The strokes gained, handicap and club distance calculators on pinflag.io are free and need no account.