Strokes Gained
Golf Shot Dispersion, Explained
Shot dispersion is the two-dimensional pattern of where a club’s shots actually finish — a distance axis and a left-right axis together, not the single average-yardage number most golfers quote. Because expected strokes are priced by where a ball lands, the shape of that pattern matters as much as its center: two players who share the same average carry can face very different strokes-gained costs depending on how wide their pattern is and what it’s aimed at.
What is shot dispersion?
Shot dispersion is the two-dimensional spread of where a club’s shots finish around a target line — a length axis (short to long) and a width axis (left to right) — not a single average-distance number.
Shot dispersion: the two-dimensional spread of where a golfer’s shots for a given club actually finish, made up of a length axis (how far short or long of the target) and a width axis (how far left or right of the target line).
Every real golf swing produces some scatter, even for the best players in the world. A dispersion pattern is normally pictured as a cloud, or an ellipse, of landing points around a target line — and the shape of that cloud, not any single number pulled from it, is the actual information. A coach who has only ever seen a student’s average 7-iron yardage has seen a fraction of the real picture.
The two axes measure different things and usually have different sizes. Length dispersion comes mostly from contact quality and swing-speed consistency; width dispersion comes mostly from face-to-path control at impact. A player can be tight on one axis and wide on the other, which is exactly why a single yardage number, however precise, cannot describe a pattern on its own.
Why do averages lie about your shot pattern?
An average distance collapses a two-dimensional pattern into one number, which hides the axis that decides how often a shot actually finishes in trouble rather than merely how far it traveled on average.
Say two golfers both average 155 yards of carry with a 7-iron. Their averages are identical. If golfer A’s shots land in a tight 10-yard-wide corridor and golfer B’s land across a 30-yard-wide fan, they do not have the same shot — they have the same average of two very different shots. The average alone cannot say which player is more likely to finish in the fairway, the rough, or worse, because it only describes the center of the pattern and says nothing about its width.
| Distance | Fairway | Rough | Cost of missing the fairway |
|---|---|---|---|
| 155 yd | 2.960 | 3.210 | +0.250 strokes |
| 120 yd | 2.850 | 3.080 | +0.230 strokes |
Both rows show expected strokes to hole out from that distance — lower is better. From 155 yards, the fairway baseline is 2.960 and the rough baseline is 3.210, a difference of 0.250 strokes (3.210 − 2.960) for landing in the wrong grass at the identical distance. A tight pattern that stays inside the short grass and a wide one that regularly bleeds into the rough can post the exact same average carry and still cost noticeably different numbers of strokes across a round — the width of the pattern, not its center, decides how often that 0.250-stroke penalty actually gets paid.
A pattern is two-dimensional; an average is one
The width of a shot pattern is information an average distance throws away entirely. Two golfers can share an average carry and face different strokes-gained outcomes purely because one pattern is wider than the other.
Carry vs. total: two different distances
Carry is how far the ball flies before it first lands; total is carry plus roll — and because roll depends on turf, slope, and moisture, a pattern built from carry numbers does not automatically describe what happens on a given piece of ground.
Carry distance: the distance a ball travels through the air before it first touches the ground — a number that depends on the swing and the strike, largely independent of the ground it eventually lands on.
Total distance: carry distance plus roll — how far the ball continues to travel after it lands, which depends on firmness, slope, grass length, and moisture, and can vary from hole to hole on the same course.
This distinction matters for dispersion specifically because the two common ways of measuring a shot pattern default to different distances. A launch monitor measures carry directly — and, on some units, models a total based on assumed turf conditions. On-course tracked data, by contrast, captures wherever the ball actually finished that day, which already includes whatever that particular fairway did to it after it landed. Neither number is wrong; they answer different questions, and mixing them up is a common source of a player’s range numbers and course numbers appearing to disagree.
Expected-strokes baselines are keyed to where a ball actually finishes — distance and lie — not to carry in isolation. A dispersion pattern used to reason about strokes gained should ultimately describe finishing position, roll included, which is one reason on-course tracked patterns and launch-monitor patterns are kept as separate, labeled sources rather than merged into one number. More on that distinction in launch monitor data on the course.
How much data do you need before a pattern means something?
A handful of shots can look tight or wide by pure chance; the true shape of a pattern, especially its tails, only stabilizes with enough repetitions — so an early read should be treated as a hypothesis, not a verdict.
Three or five swings can cluster tightly by chance, or spray wide by chance, without either result reflecting a player’s real tendency. This matters most for the tails of the distribution — the occasional bad miss — which is exactly the part of a pattern that strategy decisions care about most, and exactly the part that takes the longest to reveal itself honestly.
On-course samples are naturally scarce: a player might hit a given club from a similar yardage only a handful of times across an entire season. Launch-monitor sessions solve the volume problem — dozens of reps in a single visit — but at the cost of describing a different environment (see the section above). A robust reading of a pattern treats a thin sample cautiously rather than confidently: outliers get flagged and examined rather than silently smoothed away or, worse, silently deleted, because a single mis-hit early in a session can otherwise distort a pattern that has not yet accumulated enough real swings to average out.
A small sample is directional, not definitive
Even a handful of shots gives a useful hint about a tendency worth watching. Treat an early pattern as a hypothesis and let more repetitions confirm or correct it — the same discipline strokes gained tracking requires before a trend counts as real.
How should dispersion drive target choice?
Because expected strokes are priced by where a shot lands, the strokes-gained cost of a target depends on the pattern around it, not only on the distance to it — so the same pin can be a reasonable target for one player’s pattern and an expensive one for another’s.
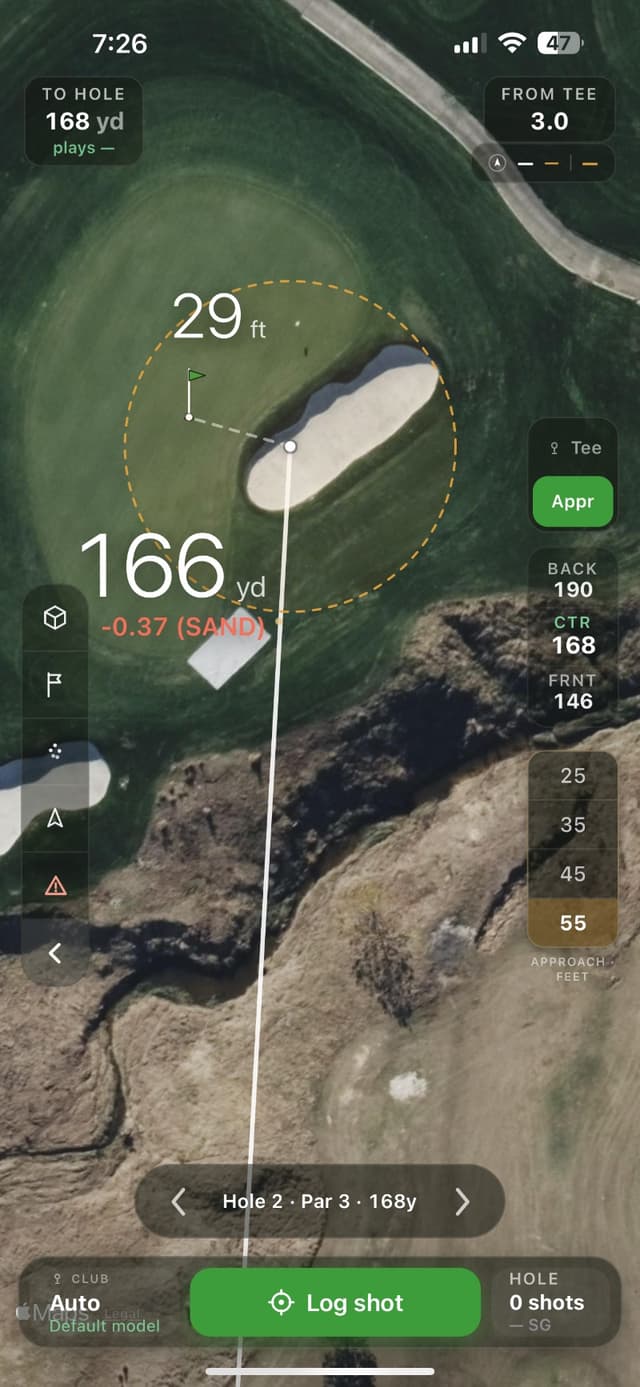
A wide dispersion pattern aimed at a pin tucked behind a bunker will, over enough attempts, put a real share of shots in that bunker — even when the center of the pattern sits right on the flag. A tighter pattern, or one aimed at the open, fat side of the green, puts fewer shots in trouble even though its center may finish a few yards further from the pin on average. That tradeoff — average proximity versus the cost of the miss — is exactly what strokes gained is built to price, and it only becomes visible once a target is evaluated against a real pattern instead of a single yardage.
The precise distinction matters here: PinFlag does not answer “where should I aim” — it answers “what does this specific target cost.” PinFlag’s iOS app, currently in pre-release, prices the strokes-gained cost of any point you’re considering, computed from your own dispersion, and the number updates as you move the target — so you can see the impact of a line before you commit to it rather than after.
For a coach, the practical takeaway is that a student’s real pattern — not their average number — is what should size the target, the club, and the margin left from trouble. That reasoning applies with particular force around the pin, which is the subject of why pin location matters, and to the approach shot generally, covered in approach shot strategy.
Why can launch monitor and on-course patterns look different?
A launch-monitor pattern and an on-course pattern describe two different environments — repeated stock swings under controlled conditions versus one real shot at a time on real turf — so treating them as interchangeable, or averaging them together, produces a number that accurately describes neither.
| Launch monitor | On-course | |
|---|---|---|
| What it captures | Ball flight for a stock swing, shot by shot, usually off a mat or a flat lie | Wherever the ball actually finished, on real turf, in real conditions |
| Reps per session | Many swings with the same club in a short window | A handful of swings per club across an entire round |
| What varies shot to shot | Relatively little — conditions are close to constant | Lie, slope, weather, and nerves all vary |
| Best read as | A fast, repeatable look at swing and ball-flight tendencies | What actually happens when the shot counts on a course |
Neither pattern is more true than the other — they are measurements of different things. A launch monitor’s controlled environment is exactly what makes it useful for isolating swing tendencies; a course’s uncontrolled environment is exactly what makes it the only real record of what a player’s shots are worth in play. Because they describe different conditions, PinFlag never blends a launch-monitor pattern with an on-course pattern into one averaged number — a strokes-gained figure says which source it came from, and the two are never mixed. The full mechanics of moving range data onto the course — what carries over, what doesn’t, and the unit mistakes that trip up the transfer — are covered in launch monitor data on the course.
Frequently asked questions
What is a good golf shot dispersion pattern?
Is carry distance or total distance more useful for measuring dispersion?
How many shots do I need before my dispersion pattern is reliable?
Should I use my launch monitor numbers or my on-course numbers to plan strategy?
Does a wider dispersion pattern always cost more strokes gained?
Who developed the framework behind expected strokes and dispersion-based decisions?
Sources
Keep reading
Strokes Gained
Strokes Gained Explained: The Complete Guide
Strokes gained measures every shot against a benchmark of expected scores, revealing exactly where you gain or lose strokes versus a chosen standard — instead of guessing from fairways, greens, and putts.
Strokes Gained
Strokes Gained Approach, Explained
Strokes gained approach measures your shots into the green from beyond about 30 yards — and it is the single biggest separator between skill levels.
Strokes Gained
Why Pin Location Matters (and When to Ignore It)
Expected strokes change with where the pin is cut on a green, not only with how far away it sits, which is why short-siding a shot is usually more expensive than missing long on the fat side. Pin position should widen or narrow your target, and on a handful of dangerous pins the right move is to play to the center of the green and effectively ignore the flag.
Track & Improve
Launch Monitor Data on the Course: What Carries Over
A launch monitor and an on-course tracker measure two different environments, so a number from one does not automatically transfer to the other unmodified. Carry usually holds up well from range to course, while total distance, unit settings, and the sheer variability of on-course lies are where range numbers most often mislead — which is why the two should stay labeled and separate rather than blended into one average.